Plotting a Point
If the x-coordinate and the y-coordinate of a point are given, we can plot
the point on a Cartesian coordinate system.
Procedure —
To Plot a Point on a Cartesian Coordinate System
Step 1 Draw (or imagine) a vertical line through the x-coordinate of
the point.
Step 2 Draw (or imagine) a horizontal line through the y-coordinate
of the point.
Step 3 Place a dot where the lines intersect.
Example 1
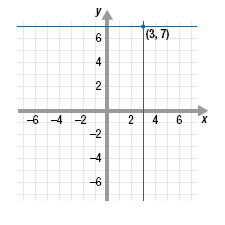
Plot the point (3, 7) on a Cartesian coordinate system.
Solution
Step 1 Draw (or imagine) a vertical line through the x-coordinate of the
point.
Draw a vertical line through the x-axis at 3.
Step 2 Draw (or imagine) a horizontal line through the y-coordinate of
the point.
Draw a horizontal line through the y-axis at 7.
Step 3 Place a dot where the lines intersect.

Example 2
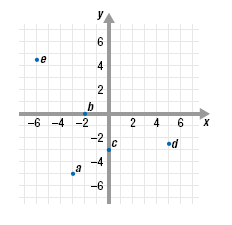
Plot each point on a Cartesian coordinate system.

Solution

Exercise 3
The data in the table represent the total distance traveled by a car in
0 hour, 1 hour, 2 hours, and 3 hours. Plot the data on a Cartesian
coordinate system.
|
t time (hours) |
d
distance (miles) |
|
0 |
0 |
|
1 |
40 |
|
2 |
80 |
|
3 |
120 |
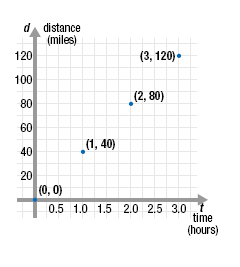
Solution The data correspond to these points: (0, 0), (1, 40), (2, 80), (3, 120)
To plot these points, we change the way we display the coordinate system.
Horizontal axis:
• The first column in the data table represents time, so we label the
horizontal axis t instead of x.
• The times are between 0 and 3 hours, so we change the scale of the
horizontal axis so each mark represents 0.25 hours.
• There are no negative times, so we do not show much of the negative
horizontal axis.
Vertical axis:
• The second column in the data table represents distance, so we label the
vertical axis with the letter d instead of y.
• Since the distances range from 0 to 120 miles we change the scale of the
vertical axis so that each mark represents 10 miles.
• There are no negative distances, so we do not show much of the negative
vertical axis. The four points are plotted on the graph.

|
